Yesterday I talked with a colleague of mine about quality control for education. He just started as a coordinator of an undergraduate programme at our university and is now searching for ways to increase the standards and improve the outcomes. I advised him to treat a course or a study curriculum as a genuine process in which you have inputs (ignorant students) that are transformed into outputs (knowledgeable starting professionals). If Toyota would be asked to design such a process, it would start by putting in quality control checks at all the critical points.
For my courses I'm using Moodle as a kind of educational ERP system. It contains the whole structure of a course in the form of content and activities. Each interaction of a student with the content or activity is saved as a transaction. By aggregating the transactions continuously, quality deviations can be noticed almost immediately allowing for much earlier intervention and better understanding of study processes.
My colleague plans to use Moodle's feedback activity for regular student satisfaction surveys. One problem with surveys however is that if you use standard scales (e.g. Likert) you miss out on a lot of information compared to using open questions. The problem with the latter is that the processing of the outcomes consumes a lot of time.
Unless of course you could automate that!
With R you can. Using the
syuzhet package you can read in the surveys and have them scored for emotions and sentiment. These scores can then be visualised making it easier to analyse the data.I've build a concept Shiny app that implements this idea. The outcomes of the Moodle feedback activity can be downloaded as CSV. This CSV can be uploaded and processed into sentiment scores. The scores are visualised using
plotly and presented as a data table.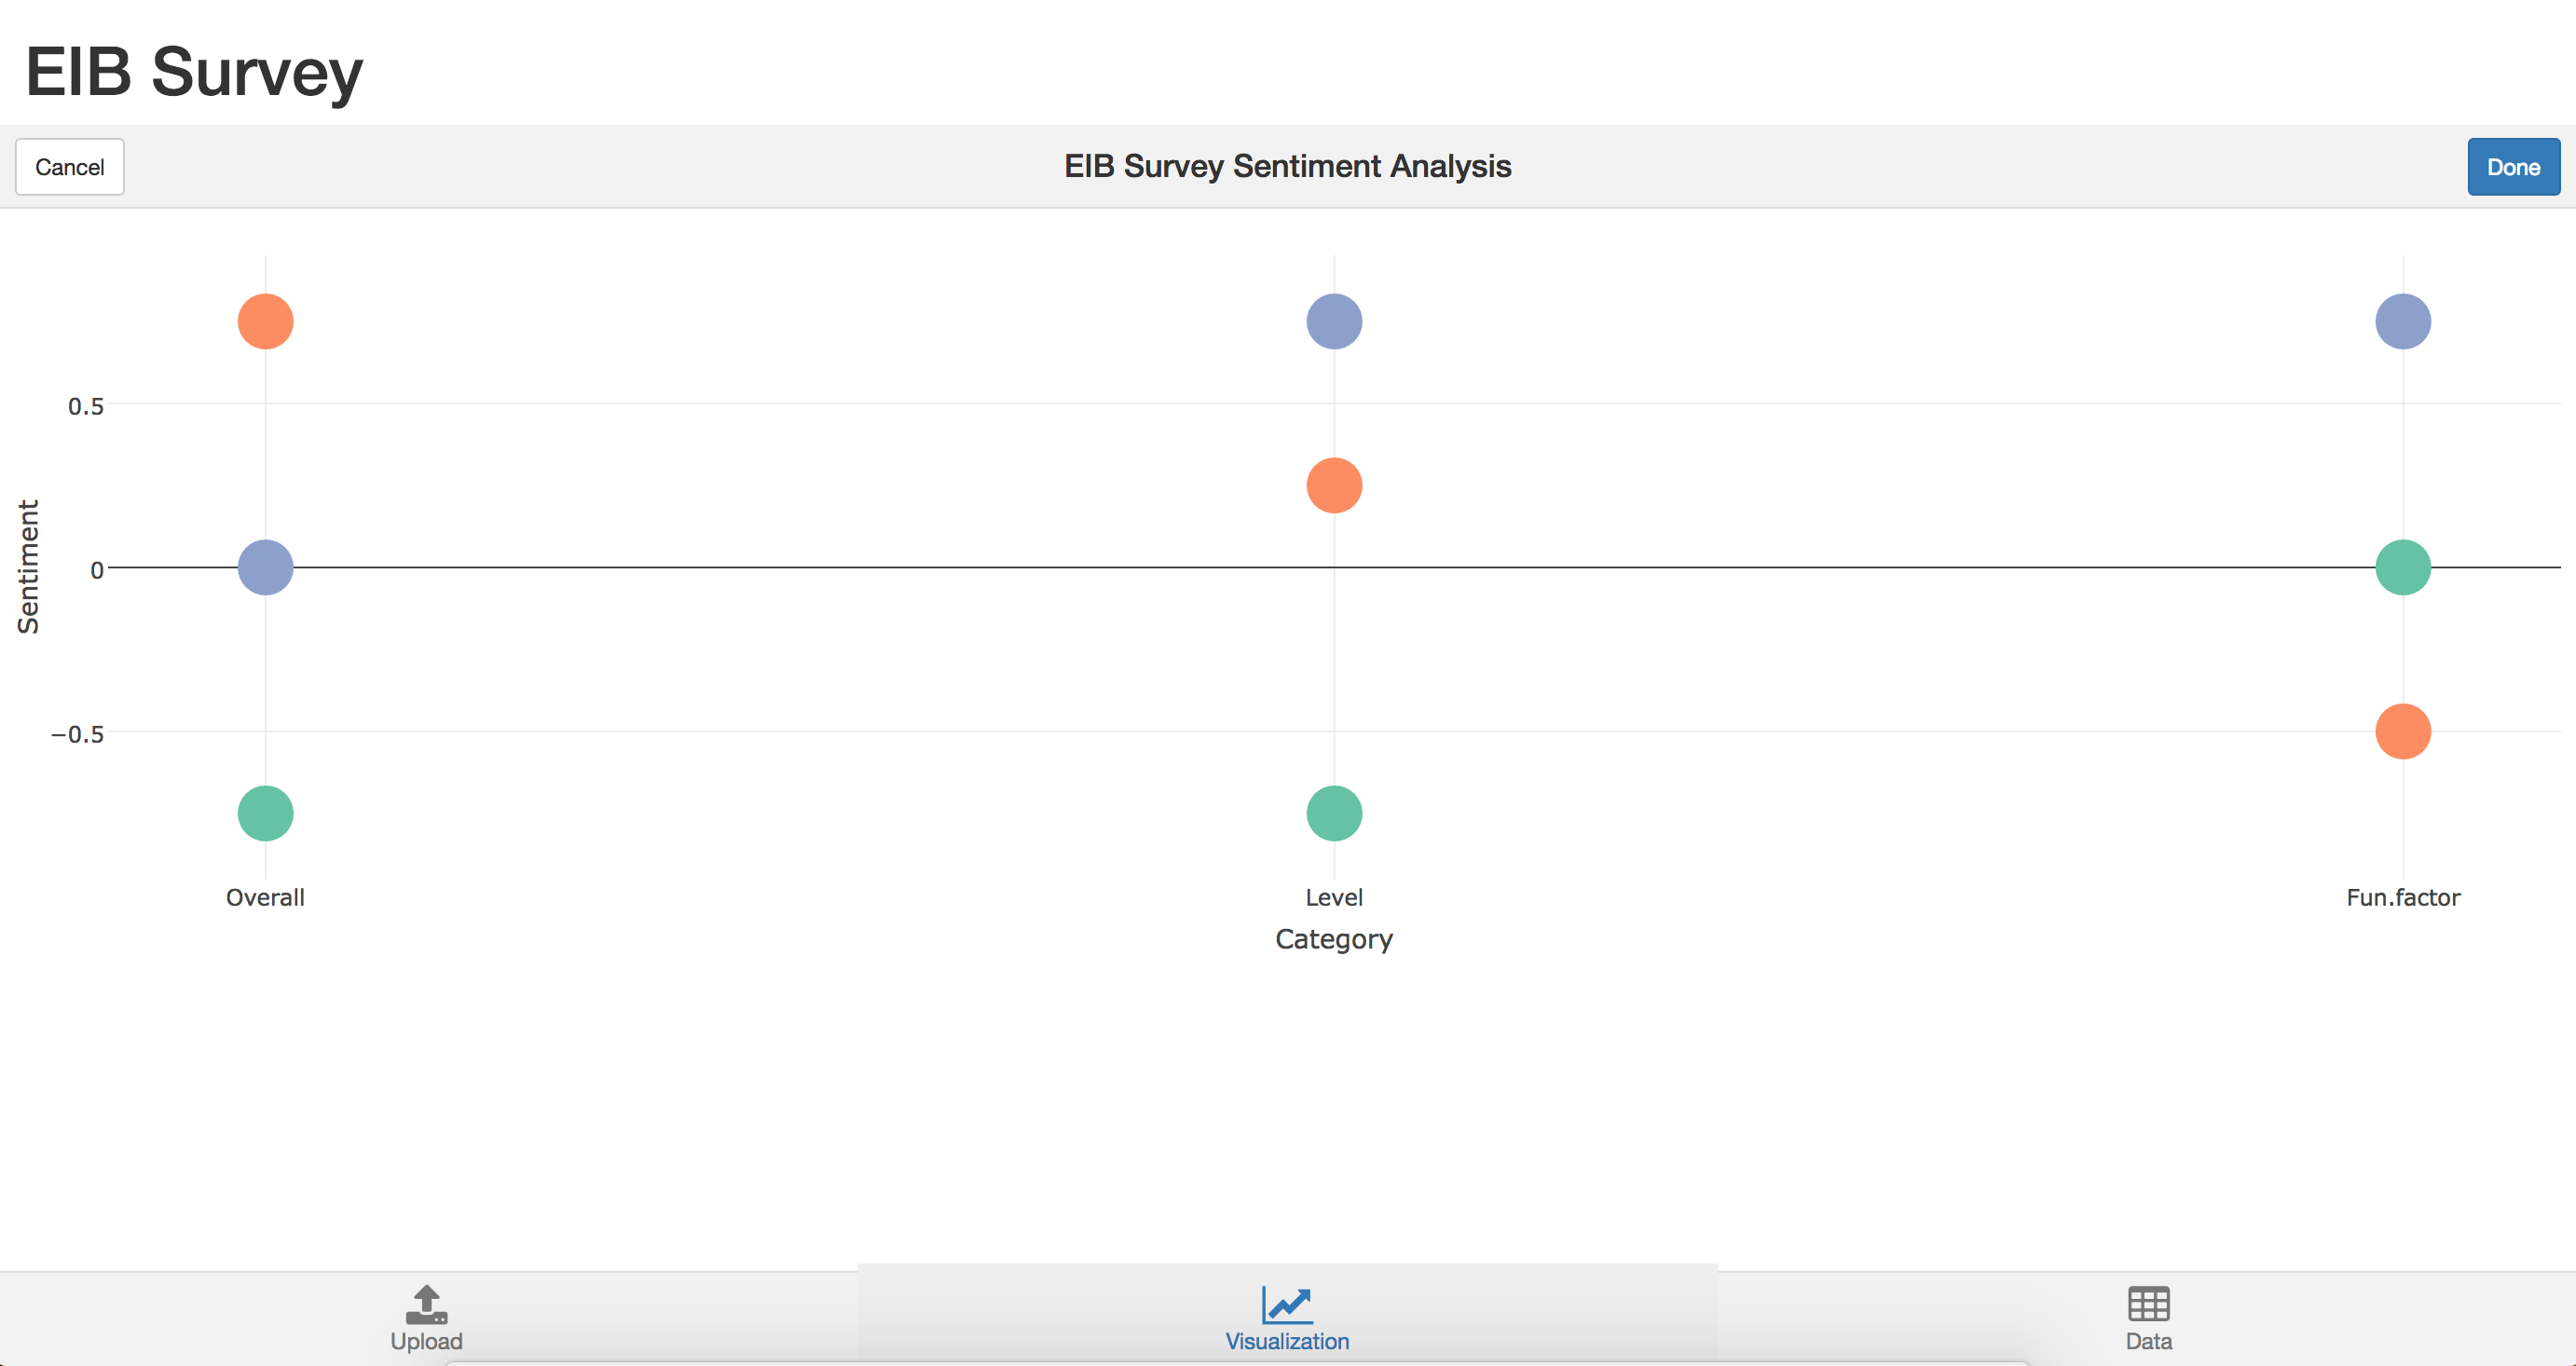
The code for the app as well as a test CSV file can be found on github.com/minorsmart/FEB2017/tree/master/Witek/SurveySent.
